Monthly Totals
This is the total amount (depth) of precipitation received over the course of each month, plotted as a box plot.
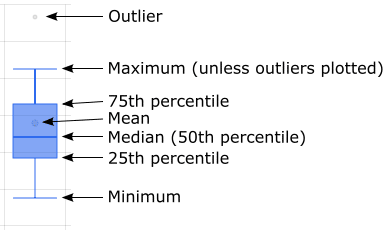
Outliers
Users can choose whether to include statistical “outliers” when plotting the maximum and minimum whiskers. Ignoring outliers can help to provide a more helpful scale to the plot.
If outliers are ignored, the whiskers extend to the most extreme data point which is no more than 1.5 times the length of the box away from the box.
Whisker minimum = Q1 – 1.5 * IQR
Whisker maximum = Q3 + 1.5 * IQR
Monthly precipitation days
This is the number of days in each month where the daily precipitation exceeds a threshold of 0.1 mm, plotted as a box plot.
0.1 mm is an arbitrary value; unfortunately there is no commonly-defined standard. However it provides an indication of how often there is at least some precipitation. Recall that precipitation includes drizzle, snow and sleet.
Annual totals
This is the total amount (depth) of precipitation received over the course of each year.